 | 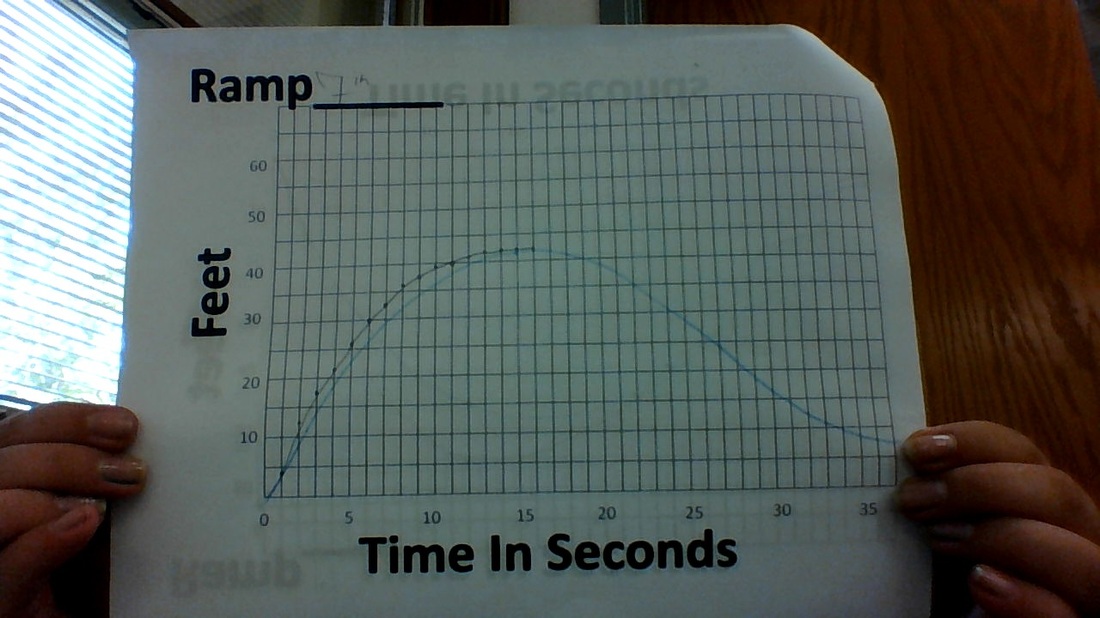 |  |
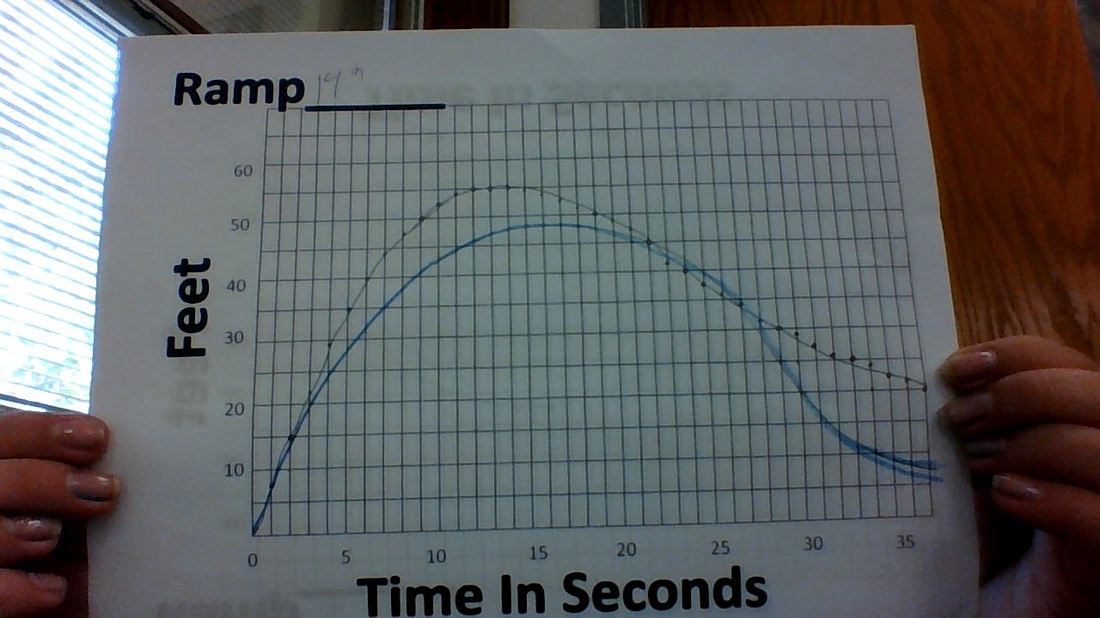
1.) For the graph of the 21in ramp my prediction of the graph was wayh off. as for the 14 and 7in graphs my predictions were far more accurate. My predictions for 7 and 14 were different than those for the 21in because after graphing the finally figure of the first one I learned that the functions were going to be more parabolic. I'm not sure what led me to my initial graph it was more of just a random guess.
2.) The domains on these graphs represent the amount of time elapsed during the skateboard's movements. The ranges of the graph represent the distance traveled by the skateboard in each period of time.
3.) As the ramp gets shorter the maximum of the graph gets lower. This is because with a shorter ramp the initial momentum of the object is lower. All three graphs start at zero for obvious reasons.
4.) The graph rises the fastest in the very beginning because the object has a greater velocity and falls the fastest right after the turn around because it have the greatest momentum.
 RSS Feed