Government subsidized loans: A loan on which the government pays the interest while the student is in school and then the interest becomes the responsibility of the student (after graduation). 4.66% interest
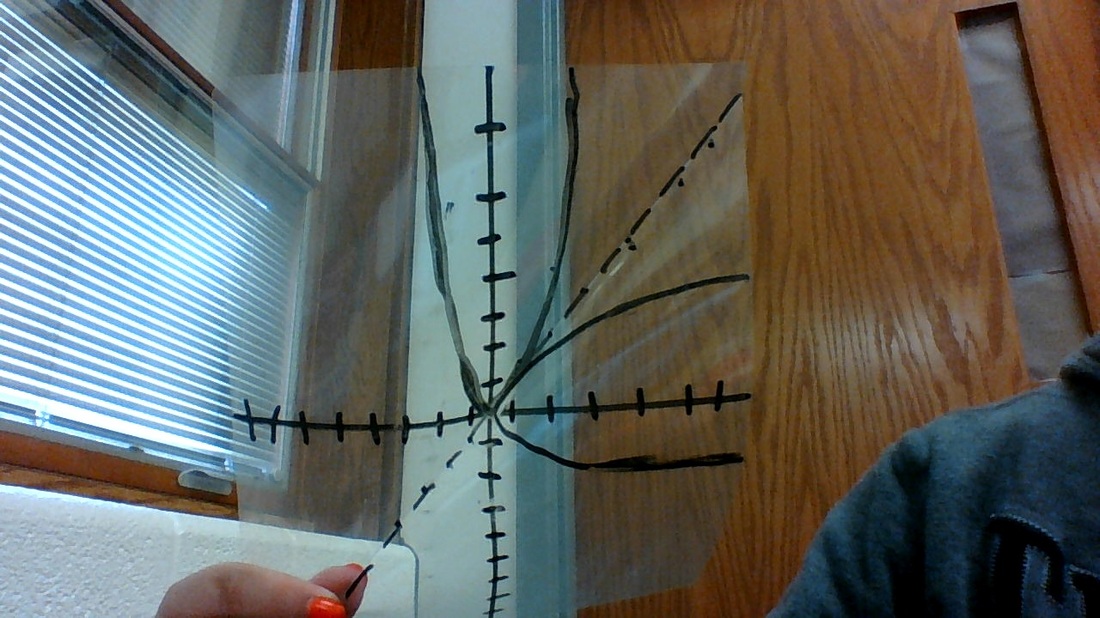
After doing the stupid geogebra thing I have concluded that the basketball is not going to land in the hoop. I think it is going to go over because of where the point landed on the graph and where the parabola is. The mathematical model of the graph is; -0.17x^2 + 1.63 +1.14. 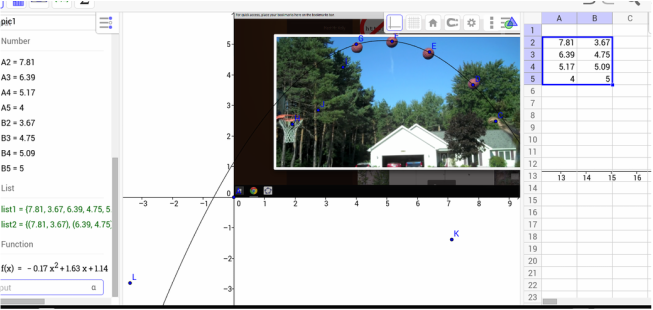 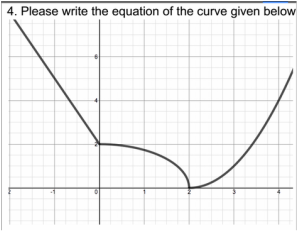 To write a function to describe the nature of graph four you have to break it down. Looking from left to right we see the first function is a linear function. The secind is a square root function. the third is the quadratic function. Then you have to find the domain for each; (from left to right) negative infinity to zero, zero to four, and four to positive infinity. So the function looks like this. (See below) 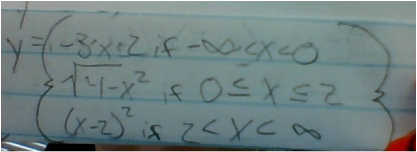
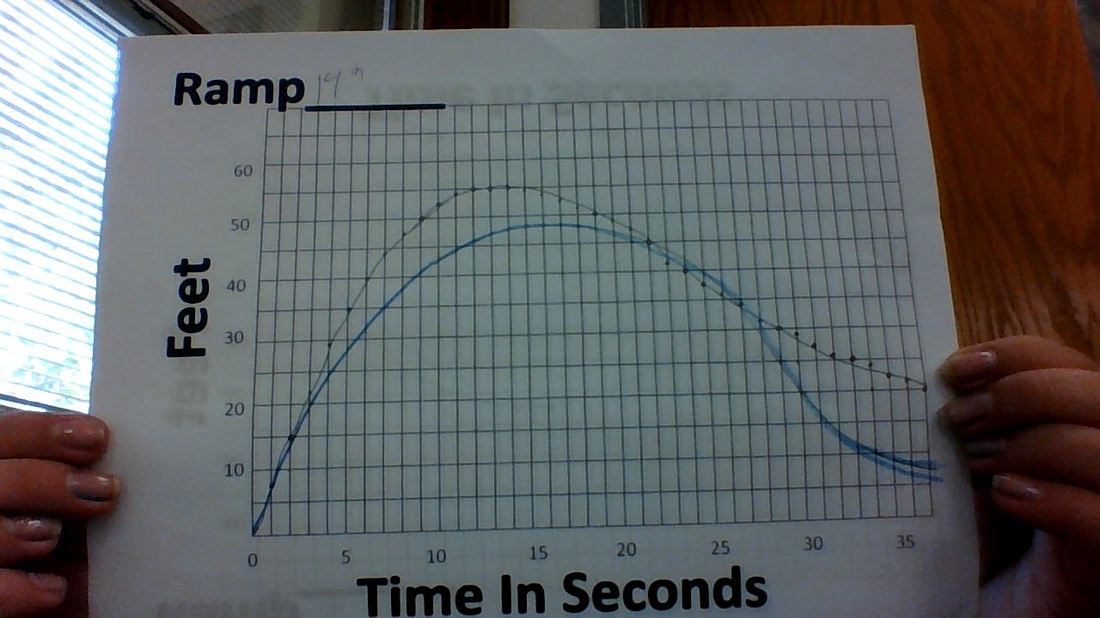
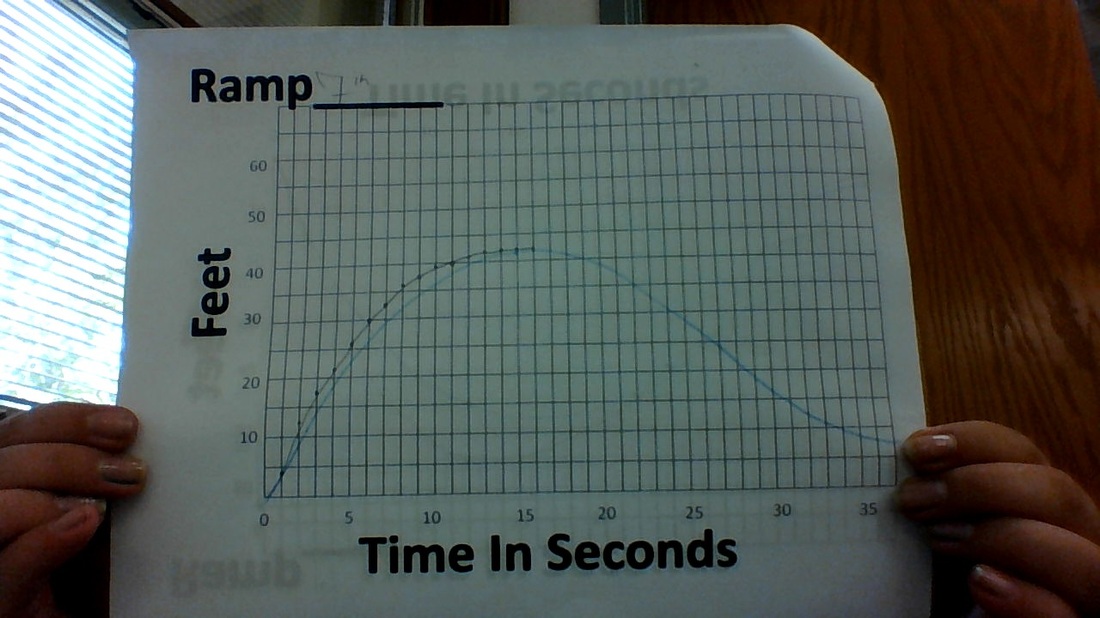
1.) For the graph of the 21in ramp my prediction of the graph was wayh off. as for the 14 and 7in graphs my predictions were far more accurate. My predictions for 7 and 14 were different than those for the 21in because after graphing the finally figure of the first one I learned that the functions were going to be more parabolic. I'm not sure what led me to my initial graph it was more of just a random guess.
2.) The domains on these graphs represent the amount of time elapsed during the skateboard's movements. The ranges of the graph represent the distance traveled by the skateboard in each period of time. 3.) As the ramp gets shorter the maximum of the graph gets lower. This is because with a shorter ramp the initial momentum of the object is lower. All three graphs start at zero for obvious reasons. 4.) The graph rises the fastest in the very beginning because the object has a greater velocity and falls the fastest right after the turn around because it have the greatest momentum. My functional art work contains 2 quadratic functions, 2 Identity functions, 2 constant functions, two vertical functions, and 2 reciprocal functions (one ordinary the other inverted.). Each positive function is reversed to create the mirrored effect you see below. 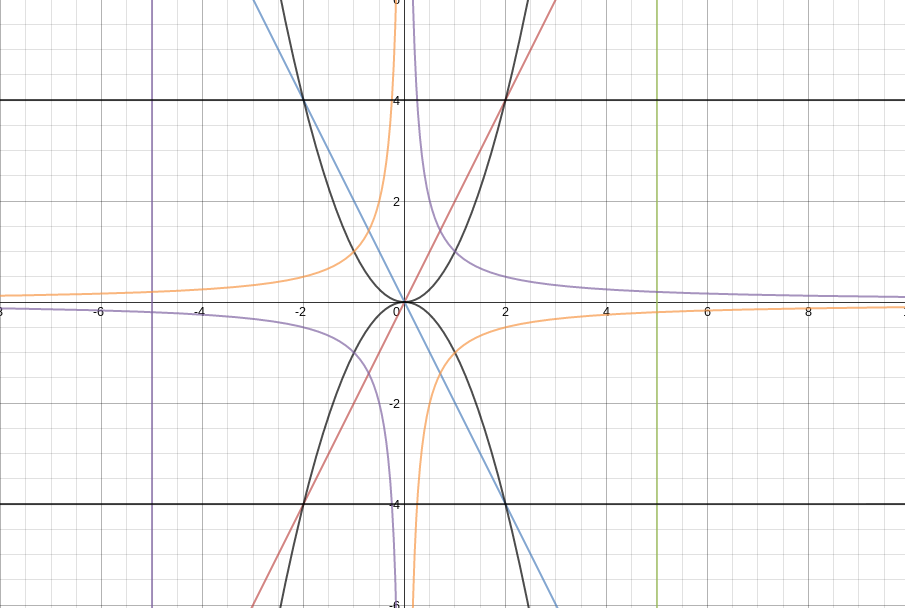
| AuthorWrite something about yourself. No need to be fancy, just an overview. ArchivesJanuary 2015 Categories |
| That's Just Who I Am! |
|
 RSS Feed